
A recovery-curve benchmark can be built from public data alone, for three purchasers. PRA Group and Encore Capital print a full table of cash collections by purchase year and collection year in every annual report, and Kruk prints one as percentages of purchase spend. Stitched across reports, they give triangles of 11 to 22 purchase years.
On unsecured books, a plain chain-ladder forecast of next year’s collections for the whole book was off by 6% to 11% on average across the three purchasers. On insolvency books the smooth curves fail two and three years out. PRA and Encore stop reporting a purchase year separately after about ten years, so their data cannot value the tail. Kruk’s table runs to 19 years and shows the tail can be large.
AI-generated draft of 13 November 2026, phase 1 of a validation plan. Purchaser figures are in US$ millions unless stated; Kruk reports in PLN. The sections up to Encore and Kruk cover PRA.
Data: PRA Group
| Item | Value |
|---|---|
| Source | PRA Group annual reports for fiscal 2019–2025, PDFs from ir.pragroup.com |
| Table | “Cash Collections by Year, By Year of Purchase” |
| Segments | Americas Core, Americas Insolvency, Europe Core, Europe Insolvency (fiscal 2019–2024); U.S. Core, U.S. Insolvency (fiscal 2025 only) |
| Purchase years | Americas 2010–2024; Europe Core 2015–2025; Europe Insolvency 2015–2025 |
| History per purchase year | up to 10 collection years |
| Also parsed | “Purchase Price Multiples”: purchase price, PRA’s total estimated collections and estimated remaining collections per purchase year |
Checks on the parse:
- Every row is kept only if its values add up to the printed row total.
- 298 cells appear in more than one report. The largest disagreement between reports is $0.15m.
- Each purchase year has an unbroken run of collection years starting at the purchase year.
Excluded: Europe Core 2012–2014 (2014 holds the already-seasoned Aktiv Kapital book, so it does not start at age zero) and Europe Insolvency 2014 (only six years reported).
Curves
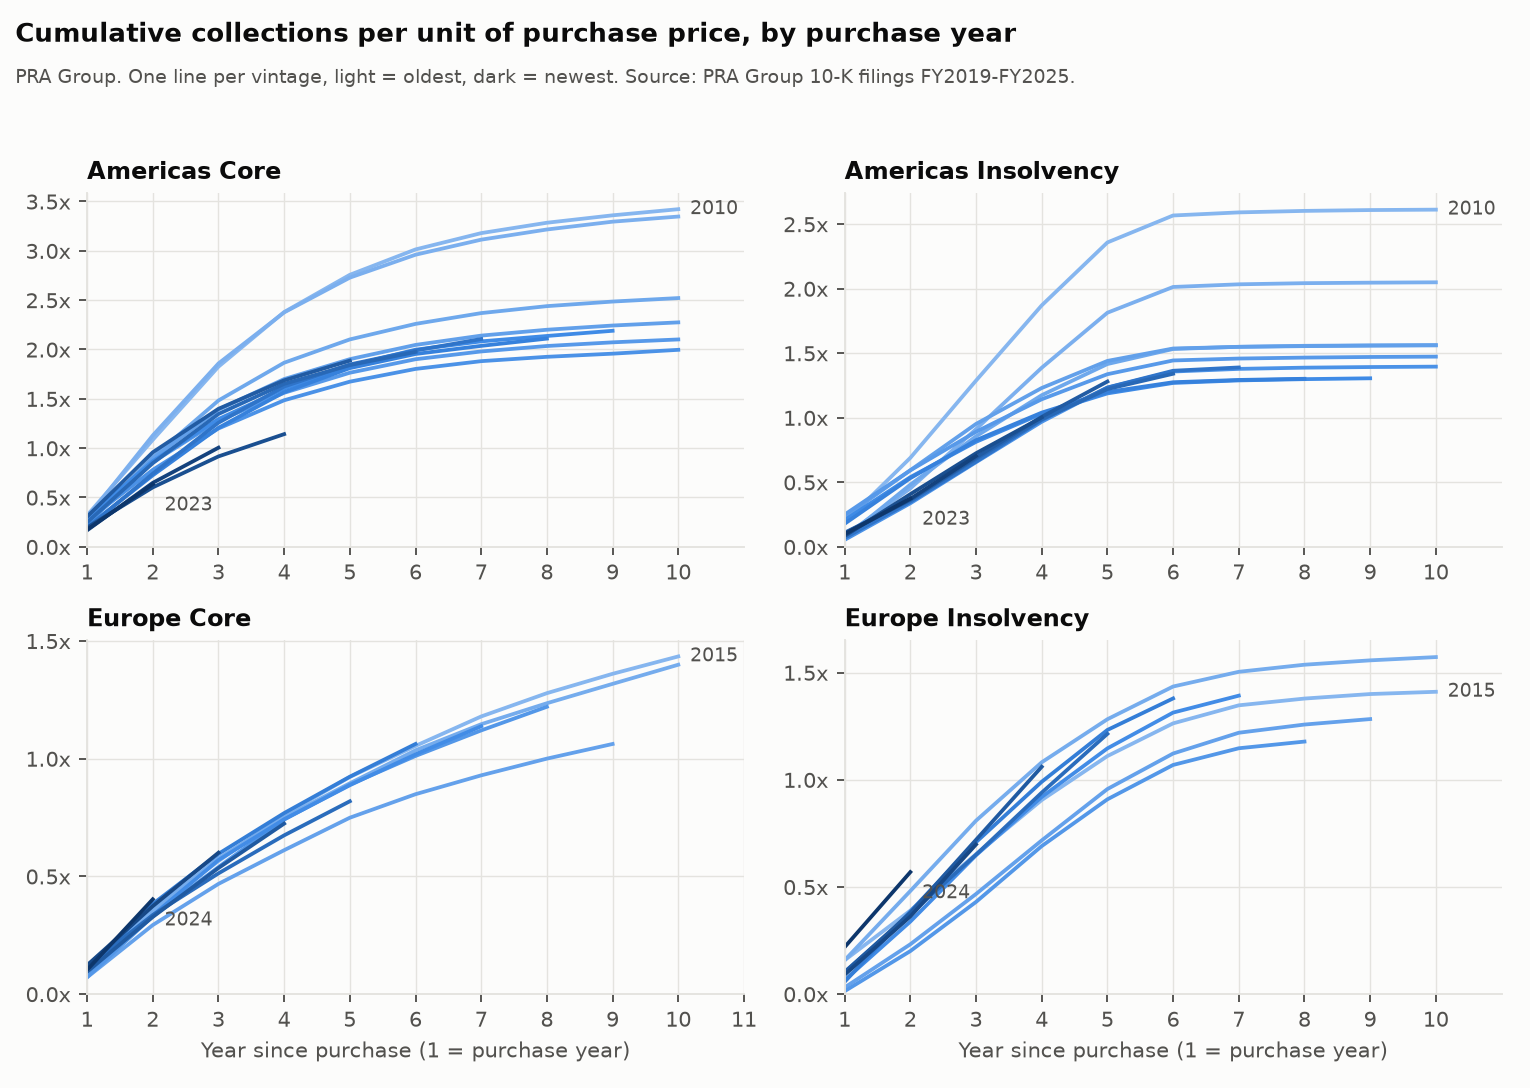
- Americas Core collects about 2.0x to 2.3x the purchase price within ten years for 2012–2015 purchases. The 2010 and 2011 purchases reached 3.4x. The 2021–2023 purchases run well below earlier years at the same age.
- Europe Core is slower and lower: about 1.4x by year 10, and still rising steadily then.
- Insolvency books flatten almost completely after year 6, at about 1.3x to 1.6x.
Method
Six models were fitted to collections per $1 of purchase price by year since purchase.
| Model | What it does |
|---|---|
| Chain ladder | Year-to-year growth factors of cumulative collections, averaged over purchase years by volume |
| Pooled | One average curve for all purchase years |
| Pooled, scaled | The average curve, scaled to each purchase year’s collections so far |
| Weibull, log-logistic, lognormal | One curve shape for all purchase years, one level per purchase year |
The purchase year counts as half a year of collecting, since purchases are spread over it.
Backtest
For each cutoff year, every model was fitted on collections up to that year only. It then predicted the next one, two and three years for every purchase year with at least two years of history. All models were scored on the same cells.
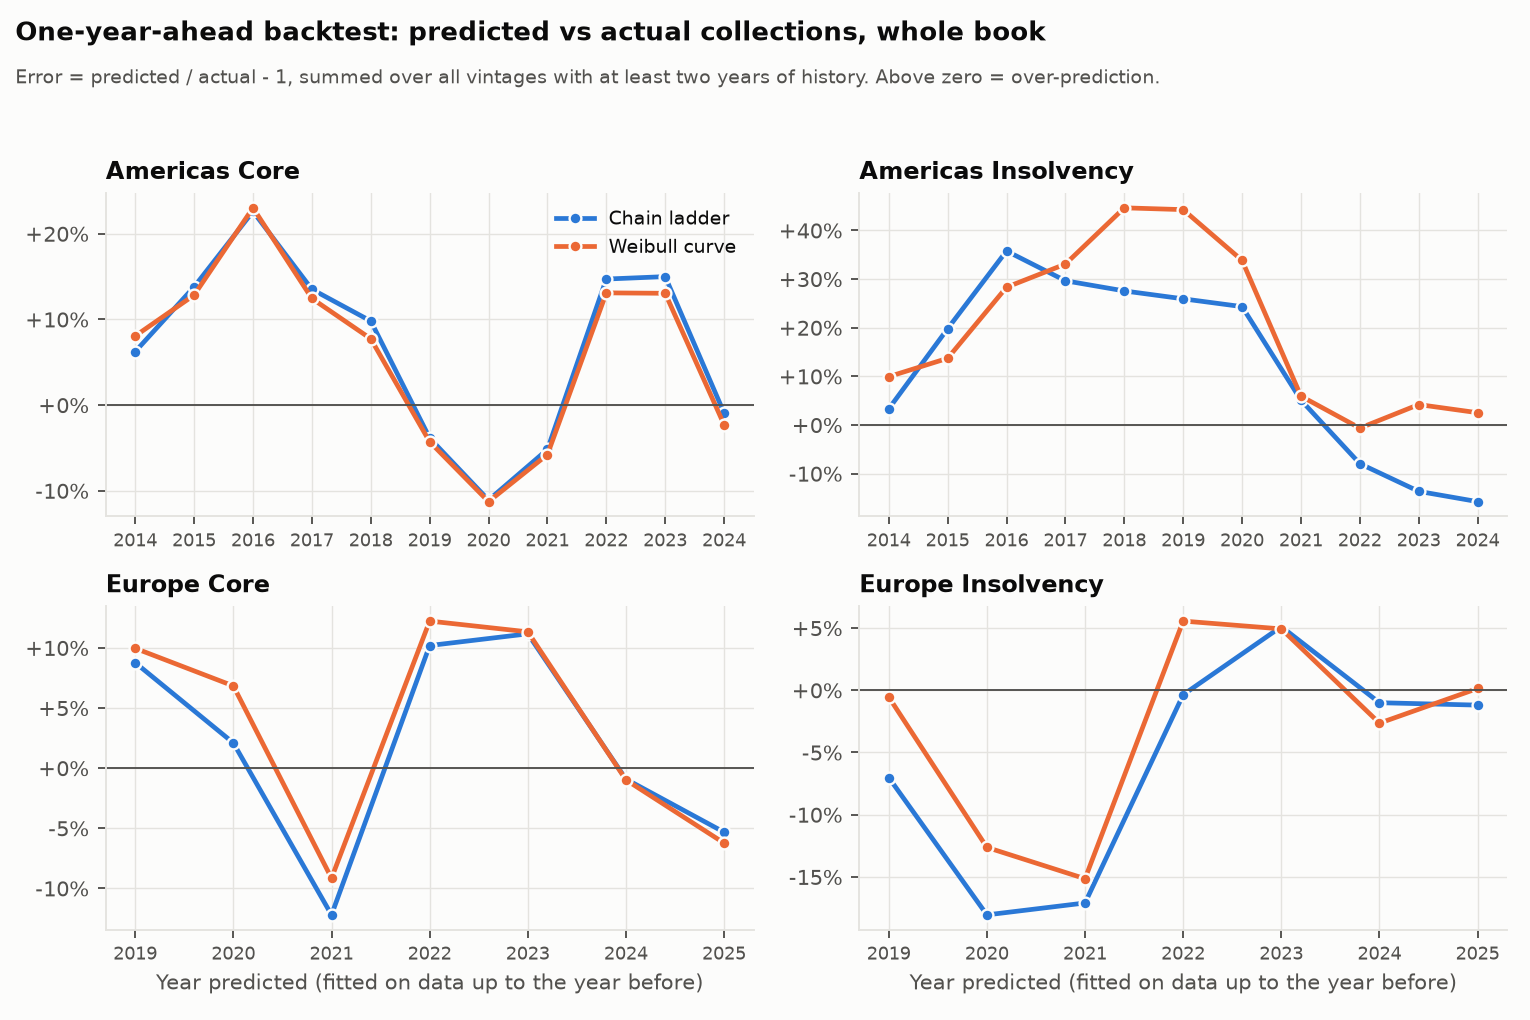
Error of the chain ladder for the whole book (predicted / actual − 1):
| Segment | Horizon | Cutoffs | Mean absolute error | Range |
|---|---|---|---|---|
| Americas Core | 1 year | 11 | 10.6% | −11% to +23% |
| Americas Core | 2 years | 10 | 16.3% | −13% to +35% |
| Americas Core | 3 years | 8 | 17.1% | −8% to +50% |
| Europe Core | 1 year | 7 | 7.2% | −12% to +11% |
| Europe Core | 2 years | 6 | 8.7% | −11% to +15% |
| Europe Core | 3 years | 4 | 2.5% | −1% to +9% |
| Americas Insolvency | 1 year | 11 | 19.0% | −16% to +36% |
| Americas Insolvency | 2 years | 10 | 35.1% | −21% to +67% |
| Americas Insolvency | 3 years | 8 | 49.6% | −29% to +104% |
| Europe Insolvency | 1 year | 7 | 7.1% | −18% to +5% |
| Europe Insolvency | 2 years | 6 | 18.9% | −47% to +3% |
| Europe Insolvency | 3 years | 4 | 21.6% | −50% to +6% |
What the errors show:
- Early cutoffs are the worst. With only the rich 2010–2011 purchases to learn from, the models over-predict later purchases. Using only cutoffs with five or more purchase years, Americas Core falls to 9.3% (1 year, 8 cutoffs), 10.1% (2 years, 6 cutoffs) and 6.6% (3 years, 4 cutoffs).
- Errors move together across purchase years. Collections beat the forecast in 2019–2021 and fell short in 2022–2023 for the whole Americas Core book. More purchase years do not average this out.
- Per purchase year, one year ahead, actual collections fell between 0.82 and 1.17 times the chain-ladder forecast in 80% of cases for Americas Core (67 cases), and between 0.88 and 1.12 for Europe Core (35 cases).
- Chain ladder and Weibull are close on Core books. Americas Core, one year ahead, error summed over purchase years: Weibull 12.6%, chain ladder 12.8%, log-logistic 15.0%, pooled scaled 17.5%, lognormal 18.9%, pooled 21.8%.
- Smooth curves fail on insolvency books. Collections stop abruptly after year 6. One year ahead, the Weibull curve predicted $101m for year 7 across the Americas Insolvency backtest where $24m arrived.
Encore and Kruk
| Item | Encore Capital | Kruk |
|---|---|---|
| Source | 15 annual reports, fiscal 2011–2025, from SEC EDGAR | Q4 2025 management report, pages 10–11 |
| Table | “Cumulative Collections … by year of purchase”, US$ thousands | Recoveries by year as % of spend on portfolios bought that year |
| Segments used | United States consumer receivables; Europe | Group only |
| Purchase years | U.S. 2004–2025 (22); Europe 2013–2025 (13) | 2007–2025 (19) |
| History per purchase year | up to 11 years | up to 19 years |
| How obtained | Parsed from HTML; every row checked against its printed total | Transcribed by eye from an image; all 20 rows sum exactly to their printed totals |
Notes on these two sources:
- Encore restates. 265 cells appear in more than one report. Europe cells never differ. U.S. cells for 2010–2014 purchases differ by up to 12% between reports; the latest report is used.
- Encore drops rows. Bankruptcy and “other geographies” rows are left out. Europe 2013 includes the Cabot book acquired that year (from memory, verify).
- Kruk is rounded. Values are whole percentages of spend. Spend per purchase year (PLN million) comes from bar-chart labels on page 10. The chart shows 2,229 for 2025; the report text says 2,223.
- Kruk mixes countries. The table is not split by Poland, Romania, Italy and Spain, and the mix has changed over time.
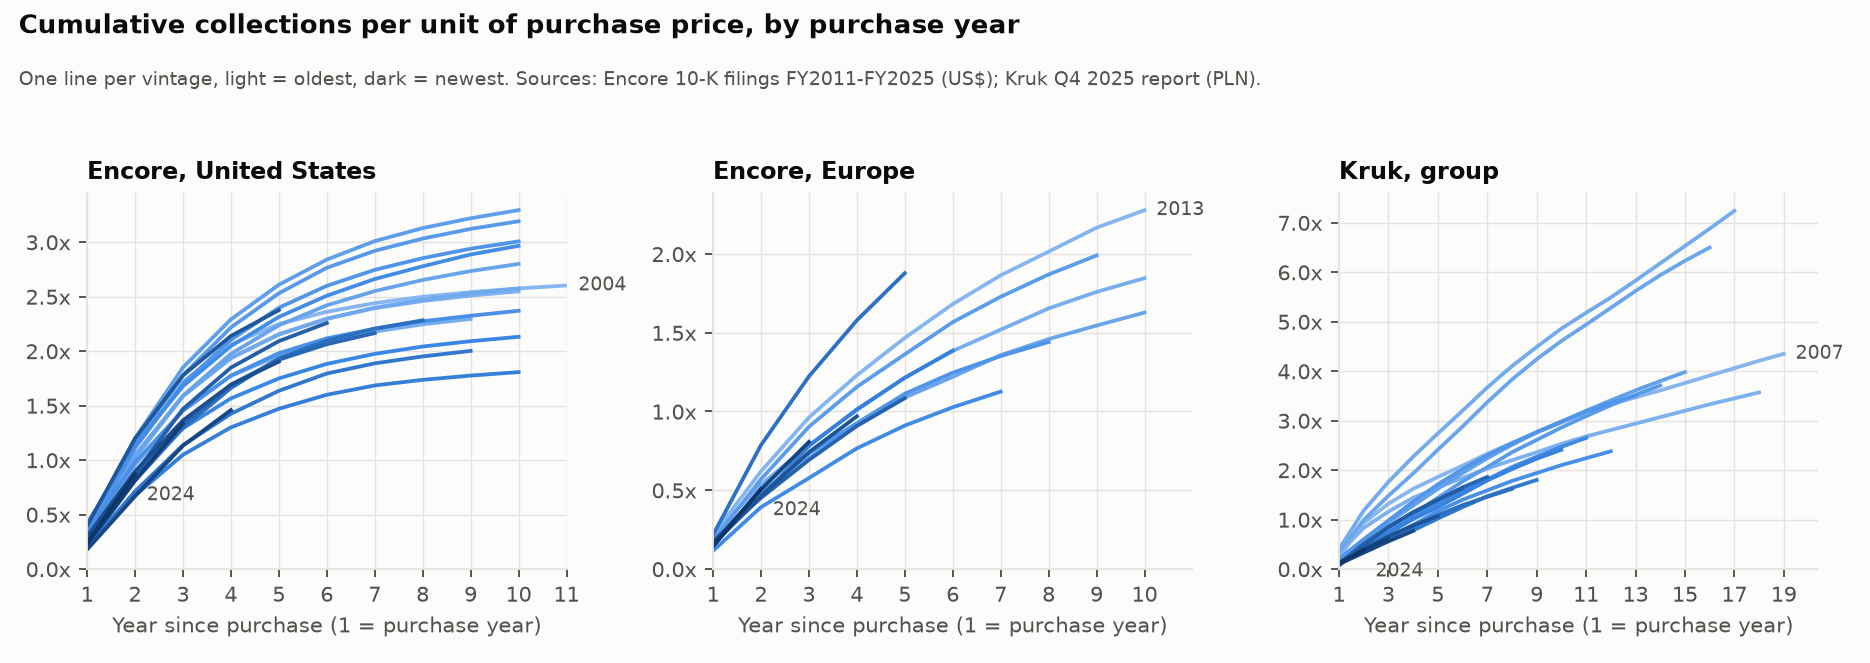
- Encore, United States looks like PRA’s Americas Core: 1.8x to 3.3x by year 10, flattening after year 6.
- Encore, Europe reaches 1.6x to 2.3x by year 10 and is still rising.
- Kruk does not flatten. Purchases aged 11 to 17 years still return about 20% of their purchase spend every year. The 2009 purchases have collected 7.2x in 17 years.
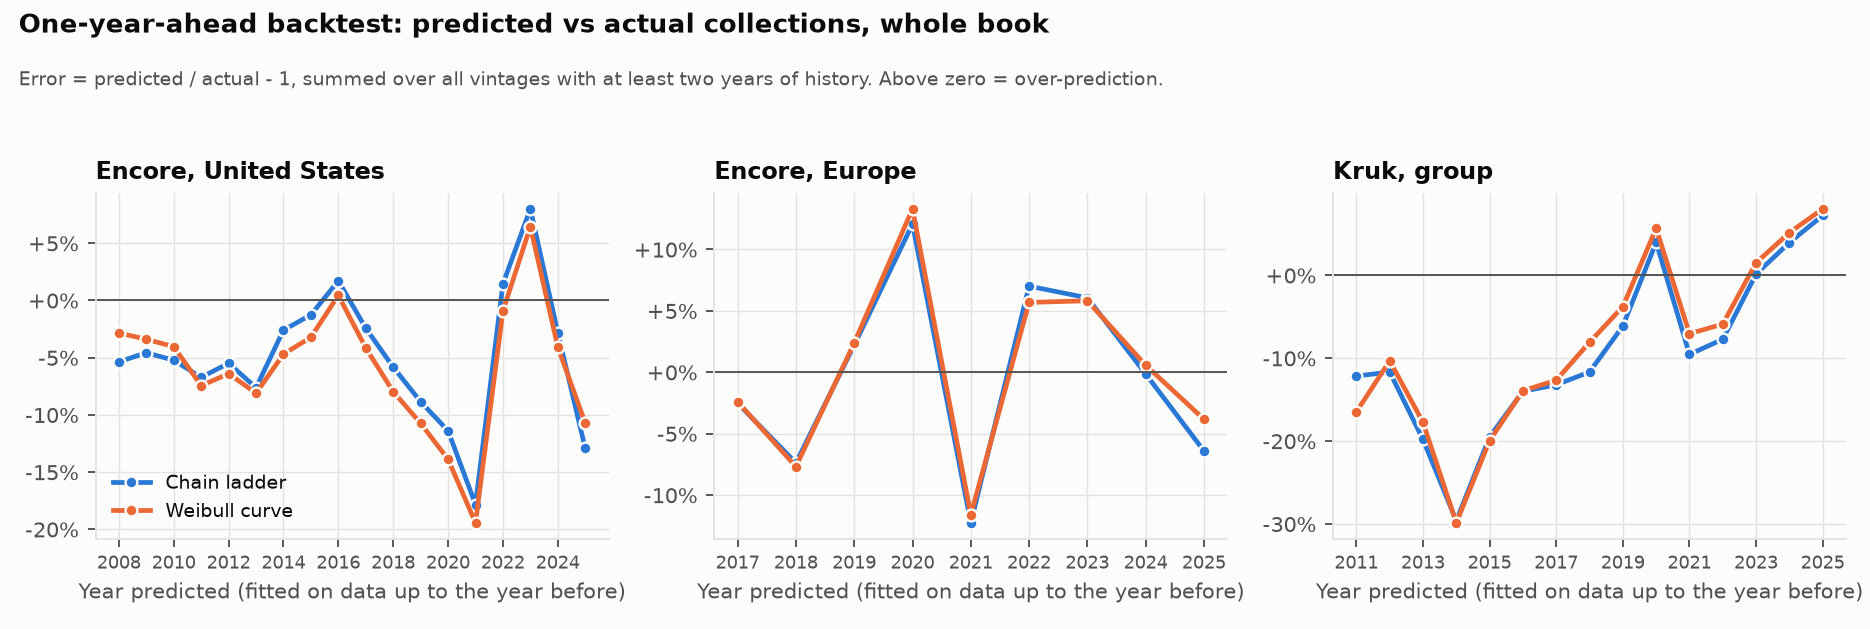
Error of the chain ladder for the whole book, same backtest as above:
| Segment | Horizon | Cutoffs | Mean absolute error | Range |
|---|---|---|---|---|
| Encore, United States | 1 year | 18 | 6.2% | −18% to +8% |
| Encore, United States | 2 years | 17 | 10.3% | −19% to +10% |
| Encore, United States | 3 years | 15 | 14.9% | −28% to +12% |
| Encore, Europe | 1 year | 9 | 6.2% | −12% to +12% |
| Encore, Europe | 2 years | 8 | 6.0% | −8% to +13% |
| Encore, Europe | 3 years | 6 | 5.2% | −2% to +12% |
| Kruk, group | 1 year | 15 | 11.4% | −30% to +7% |
| Kruk, group | 2 years | 14 | 18.4% | −42% to +8% |
| Kruk, group | 3 years | 12 | 23.0% | −51% to +11% |
- Encore’s U.S. book was under-predicted in 15 of 18 years, by 5% on average. Old purchases kept collecting a little more than earlier ones had at the same age.
- Kruk was under-predicted in 11 of 15 years, by 9% on average and by 30% for 2014. With five or more purchase years of history the three-year error falls from 23.0% to 11.7%.
- 2021 was a miss for everyone in the U.S.: Encore −18%, PRA Americas Core −5%.
Unsecured consumer loans: Bondora
A loan-level cross-check on unsecured consumer loans, built the same way as the purchaser triangles.
| Item | Value |
|---|---|
| Source | Bondora public loan file (as of 25 August 2018) and repayment file (as of 9 June 2019). Bondora has taken the files offline; these are Internet Archive copies |
| Loans used | 16,516 defaulted loans, €37.0m balance at default: Estonia 6,600, Spain 6,160, Finland 3,756 |
| Cohort | Calendar year of default, 2009–2017 (Estonia), 2013–2017 (Finland), 2014–2017 (Spain) |
| Recoveries | Every payment dated after the default date, through 2018: principal, interest and late fees. €8.5m in total |
| Price | None exists. All loans are assumed to cost the same per euro of balance at default, so curves are per €1 of that balance |
To turn a figure into a multiple of price, divide it by the assumed price. At 10 cents per euro of balance, 0.28 becomes 2.8x. Curve shape and percentage errors do not depend on the price chosen.
Check on the build: principal repaid after default, summed from the payment file to 25 August 2018, is 1.6% to 3.5% below the loan file’s own recovered-principal total per country.
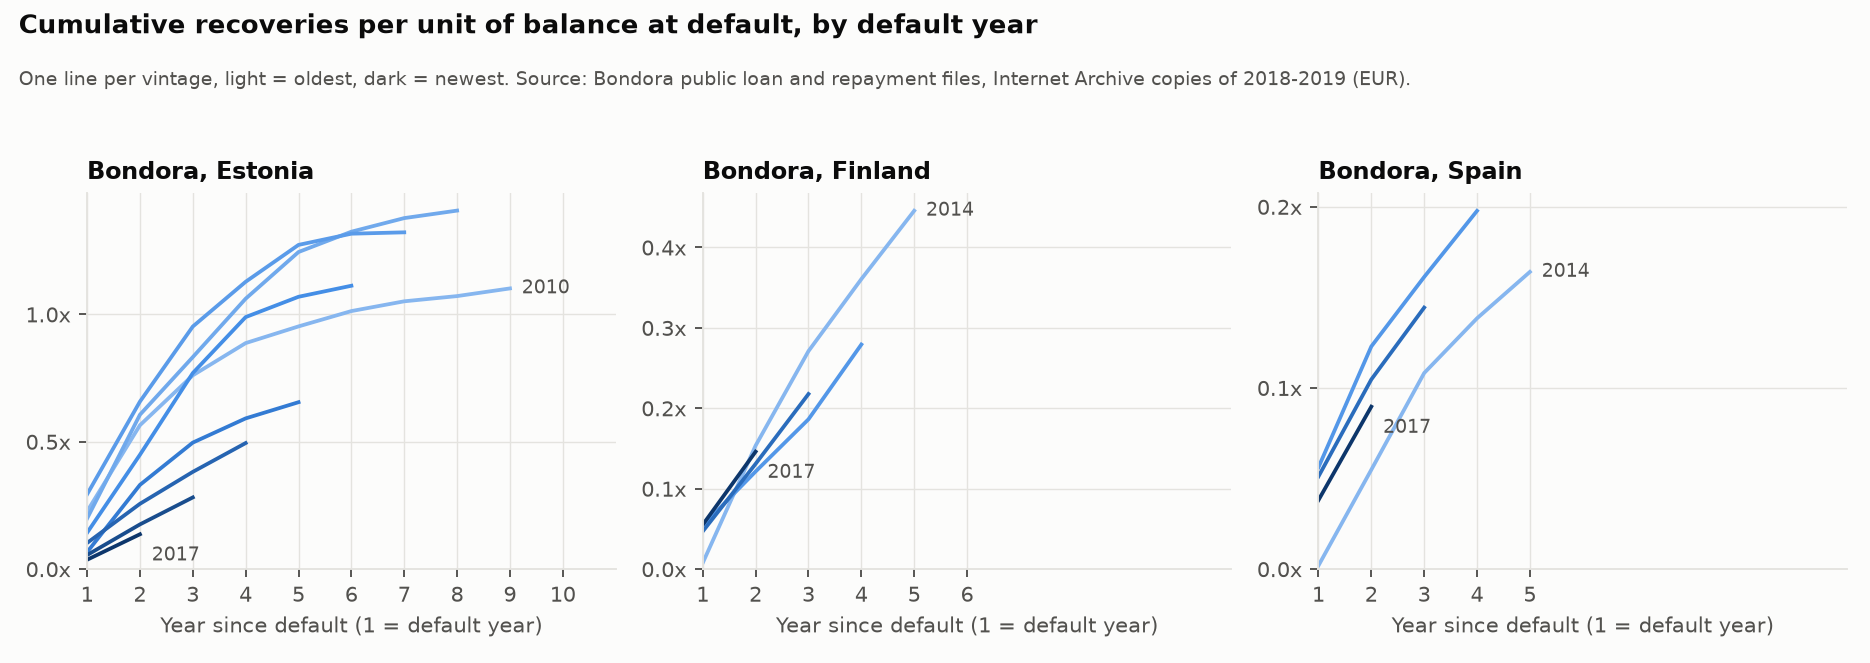
Cumulative recoveries per €1 of balance at default:
| Country | Default year | Loans | Year 1 | Year 2 | Year 3 | Year 5 |
|---|---|---|---|---|---|---|
| Estonia | 2010 | 293 | 0.23 | 0.57 | 0.76 | 0.95 |
| Estonia | 2012 | 124 | 0.29 | 0.66 | 0.95 | 1.27 |
| Estonia | 2014 | 485 | 0.07 | 0.33 | 0.50 | 0.66 |
| Estonia | 2016 | 1,509 | 0.06 | 0.18 | 0.28 | – |
| Finland | 2014 | 163 | 0.01 | 0.15 | 0.27 | 0.45 |
| Finland | 2016 | 1,202 | 0.05 | 0.13 | 0.22 | – |
| Spain | 2014 | 345 | 0.00 | 0.06 | 0.11 | 0.16 |
| Spain | 2016 | 1,646 | 0.05 | 0.11 | 0.14 | – |
- Countries differ by a factor of two to three. Three years after default, 2016 defaults had returned 28% of balance in Estonia, 22% in Finland and 14% in Spain.
- Estonian recoveries fell as the book grew. Defaults of 2010–2013 returned 76% to 95% of balance in three years and 95% to 127% in five, interest and fees included. Defaults of 2014–2016 returned 28% to 50%. Under one price for all loans, the multiple fell by the same factor. This is where the equal-price assumption is weakest.
- Timing looks like the purchasers’. Of the recoveries of the first five years, 61% to 80% arrive in the first three (seven cohorts with five years of data). The same share is 70% for PRA Americas Core, 69% for Encore U.S. and 56% for Kruk, using median multiples.
- Recoveries are still running at the end of the data. Estonian 2010 defaults collected 3% of balance in year 9.
Annual backtest, same method as above, chain ladder, whole book:
| Country | Horizon | Cutoffs | Mean absolute error | Range |
|---|---|---|---|---|
| Estonia | 1 year | 5 | 19.7% | −37% to +13% |
| Estonia | 2 years | 4 | 18.5% | −35% to +21% |
| Estonia | 3 years | 2 | 31.3% | −29% to +34% |
| Finland | 1 year | 1 | 21.5% | −21% |
| Spain | 1 year | 1 | 15.0% | +15% |
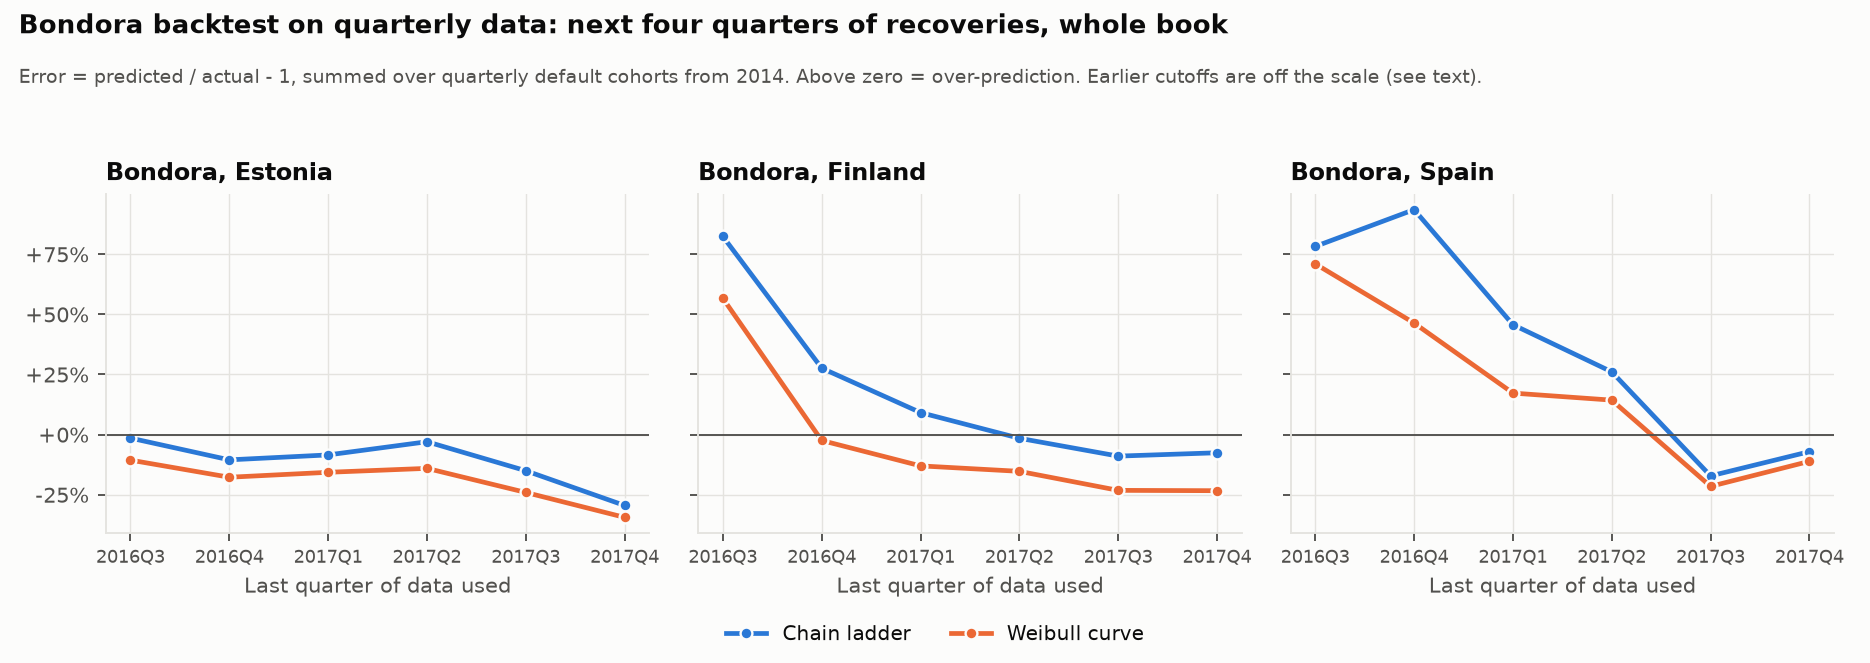
Finland and Spain have one test year each on annual data. Loan-level data allows a finer grid, so the backtest was repeated with quarterly default cohorts from 2014: fit on data up to a quarter, predict the sum of the next four quarters. Nine cutoffs, 2015 Q4 to 2017 Q4. Cutoffs are one quarter apart, so neighbouring results share three quarters.
| Country | Chain ladder, four cutoffs of 2017 | Range | Weibull, four cutoffs of 2017 |
|---|---|---|---|
| Estonia | 14.0% | −30% to −3% | 22.1% |
| Finland | 6.8% | −9% to +9% | 18.7% |
| Spain | 24.0% | −17% to +46% | 16.1% |
- Young books cannot be forecast. With ten or fewer quarterly cohorts (cutoffs to 2016 Q4), the chain ladder over-predicted Finland by 28% to 872% and Spain by 78% to 1,864%. First-quarter recoveries are near zero, so growth factors from a few cohorts explode. The Weibull curve was steadier in Spain (−6% to +71%) and no better in Finland.
- With eleven or more cohorts the error is in the purchasers’ range, 7% to 24% a year ahead.
- 2018 beat every forecast. From the last two cutoffs all three countries were under-predicted, by 7% to 30% with the chain ladder.
What differs from the purchaser data:
- The clock starts at default, not at purchase. A buyer of older debt sees a later, flatter part of the curve.
- Recoveries include Bondora’s own collection, agencies and court enforcement. Costs are not deducted.
- The data ends in 2018. Estonian cohorts before 2014 hold 124 to 293 loans each.
LendingClub
LendingClub’s public files cannot give a curve. The live downloads are gone; the Internet Archive holds loan snapshots only (LoanStats3a–3d, captured 2014–2015, and LoanStats_2019Q1).
- No dates on recoveries. Each charged-off loan has one
recoveriestotal and onecollection_recovery_feetotal. There is no charge-off date and no recovery date. The nearest date is the last payment. - The dated file is not archived. LendingClub also published a monthly payment history (
PMTHIST_ALL). The only archive capture is a redirect to the login page. A third-party script reads aPCO_RECOVERYcolumn from it; that was not verified here. - One level check is possible. In the August 2014 snapshots (loans issued 2007–2013), 14,497 charged-off loans had recovered 4.3% of the principal outstanding at charge-off. By year of last payment: 5% to 7% for 2008–2011, 4% to 5% for 2012–2013, 0.6% for 2014.
- That is far below Bondora, where 14% to 28% of balance came back within three years. The two are not like for like: LendingClub’s figure is taken at one date for all loans, and what
recoveriesincludes (for example proceeds of selling charged-off loans) was not checked.
Current book against PRA’s own estimate
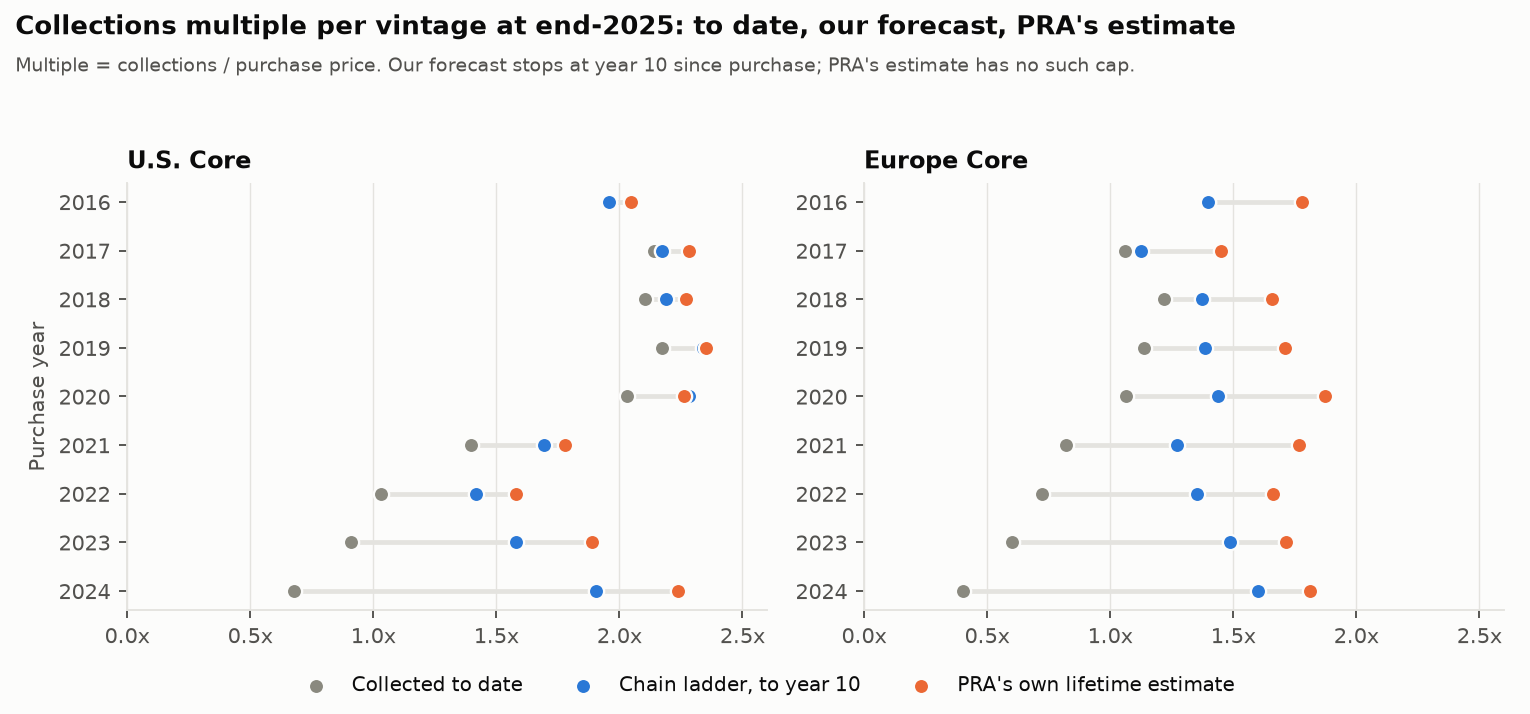
Remaining collections at end-2025 for 2016–2024 purchases:
| Segment | Collected to date | Chain ladder, remaining to year 10 | PRA’s estimated remaining collections |
|---|---|---|---|
| U.S. Core | 6,648 | 1,687 | 2,297 |
| U.S. Insolvency | 1,007 | 129 | 132 |
| Europe Core | 3,112 | 1,637 | 2,837 |
- Insolvency: the chain ladder and PRA agree within 3%.
- Core: the chain ladder is 27% below PRA for the U.S. and 42% below for Europe. Most of the gap is the cap at year 10. PRA’s oldest U.S. Core purchases (1996–2015, all older than ten years) still collected $53.6m in 2025.
- Europe figures mix exchange rates: collections at each year’s average rate, PRA’s remaining estimate at the end-2025 rate.
Limits
- Three purchasers. The curves describe their buying and collecting, not the market. They differ a lot: Kruk’s year-10 multiple is 2.1x to 4.9x, Encore’s European one 1.6x to 2.3x.
- Currencies differ: PRA and Encore in US$ (European books converted), Kruk in PLN.
- Annual data. The first-year half-year assumption is a guess.
- About ten years per purchase year for PRA and Encore. Lifetime value needs a tail assumption their data cannot test. Kruk’s longer table has not yet been used to test one.
- The U.S. segments exist only in the fiscal 2025 report, so the backtest uses the older Americas segments (U.S. plus other Americas, and Australia from fiscal 2021).
- The error ranges are spreads of past backtest errors over 4 to 11 cutoffs, not statistical intervals.
- Collections are gross cash. Collection costs are not in the table.
Other purchasers
| Purchaser | Publishes a triangle? | Status |
|---|---|---|
| PRA Group | Yes, in dollars, four segments | Parsed, backtested |
| Encore Capital | Yes, in dollars, U.S. and Europe | Parsed, backtested |
| Kruk | Yes, as % of purchase spend, 2004–2025, group level | Transcribed, backtested |
| Intrum | No table by purchase year found in the 2025 annual report | — |
| Hoist Finance | No; forward estimated collections by year only | — |
| B2 Impact | No; forward estimated collections only | — |
The Intrum, Hoist and B2 Impact rows come from a text search of their 2025 annual reports only. Encore’s own estimates of remaining collections are in its reports but are not parsed. The Bondora loan-level cross-check is in its own section above. LendingClub was checked and has no dated recoveries (same section). Freddie Mac and Fannie Mae are not done.
Exit check
The plan asks whether the backtest error is too wide to be useful. For unsecured books one to three years ahead the whole-book error averages 6% to 10% once five purchase years of history exist, with a worst case of +22%. Encore’s books land in the same range. Kruk is wider and biased low. That is usable for a back-book valuation with stated ranges. For insolvency books use the chain ladder only, and for lifetime value say plainly that the tail is an assumption.